
HBA of Michigan / Frankenmuth Insurance
Housing Permit Dashboard
HBAM collects and compiles statewide residential building permit data to help members, industry partners and policymakers better understand housing trends across Michigan. This housing permit dashboard, presented in partnership with Frankenmuth Insurance, includes interactive dashboards with monthly single-family home permit totals, average market value and average square footage summaries. Use the dashboards below to explore county-level trends or download the Excel sheets to view municipal-level data for each local HBA.

Michigan Permit Heat Map by County
The agents featured on this map are part of HBAM’s partnership with Frankenmuth Insurance which connects members with insurance professionals who understand the needs of Michigan’s residential building industry. These preferred agents can help builders navigate coverage options, protect their businesses and connect with local support in the communities they serve.
Explore the heat map of permit data by county and use the filters on the right to adjust the date. Hover over a county to view permit numbers and, where available, the Frankenmuth Insurance preferred agent serving that area. Click on a county with a preferred agent to view their full listing and contact information.


Kyle Henion
Emil Rummel Agency, Inc.
Agent - CIC
989-652-6104
Kyle joined the Rummel Agency in 2015 as a licensed property and casualty agent. His area of expertise is business and farm insurance. Using his insurance underwriting experience, Kyle has a passion for helping clients develop comprehensive insurance programs to assist in time of need and create peace of mind.

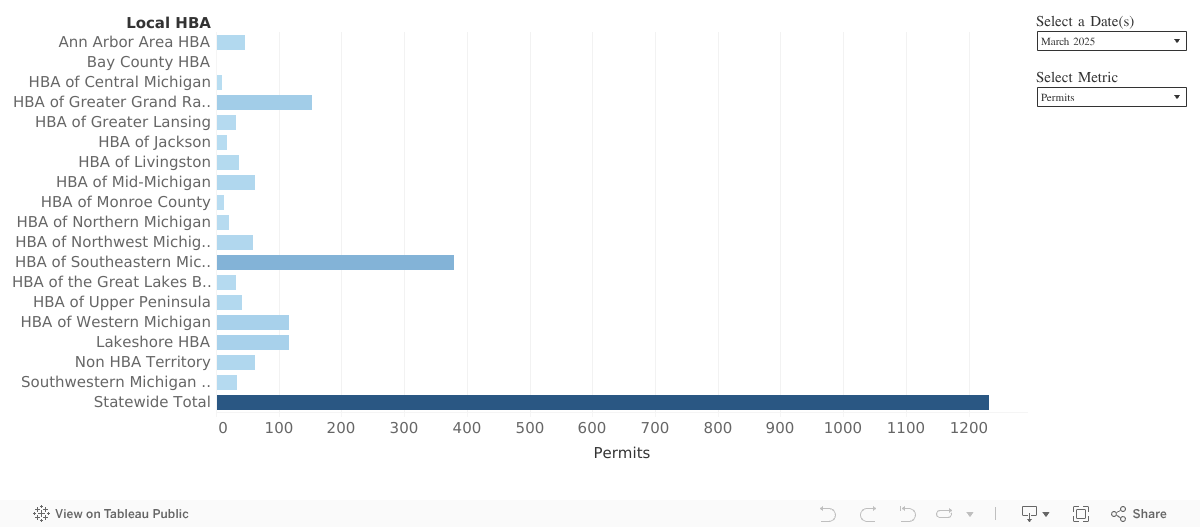
monthly permit and market value summary by local HBA
This dashboard displays total SFH permits, estimated average market value, and average derived square footage for a single month, broken down by each local HBA in Michigan. Use the dropdown on the right to select the month you'd like to view, or compare trends across multiple months.

Year-over-year SFH permit and market value data by local HBA
This dashboard provides a visual of the same monthly data along with year-over-year changes. Use the dropdowns on the right to select the month and metric you'd like to view, or mouse over the chart to view all metrics at once.
about the data
- Local HBAs may cover more than one county, to see how local HBA territories are divided, click here
- The Non HBA Territory line item is for those regions of the state currently unassigned to a specific local HBA (Alcona, Alpena, Arenac, Crawford, Huron, Iosco, Lenawee, Mecosta, Montmorency, Ogemaw, Osceola, Oscoda, Presque Isle, Roscommon, Sanilac, Tuscola);
- Permit totals are for 1-unit, residential single family home (SFH) units
- SFH permit refers to new home construction only and does not include additions or remodels
- Est. Average Market Value is calculated using a 42% factor (i.e., x1.42) applied to the average permit value to cover land, profit and O/H
- Average Derived SF is calculated using average permit value divided by the monthly US Construction Producer Price Index (PPI)
- Sources: US Census Bureau, St. Louis Federal Reserve; Calculations by HBA of Michigan